Concordia Energy
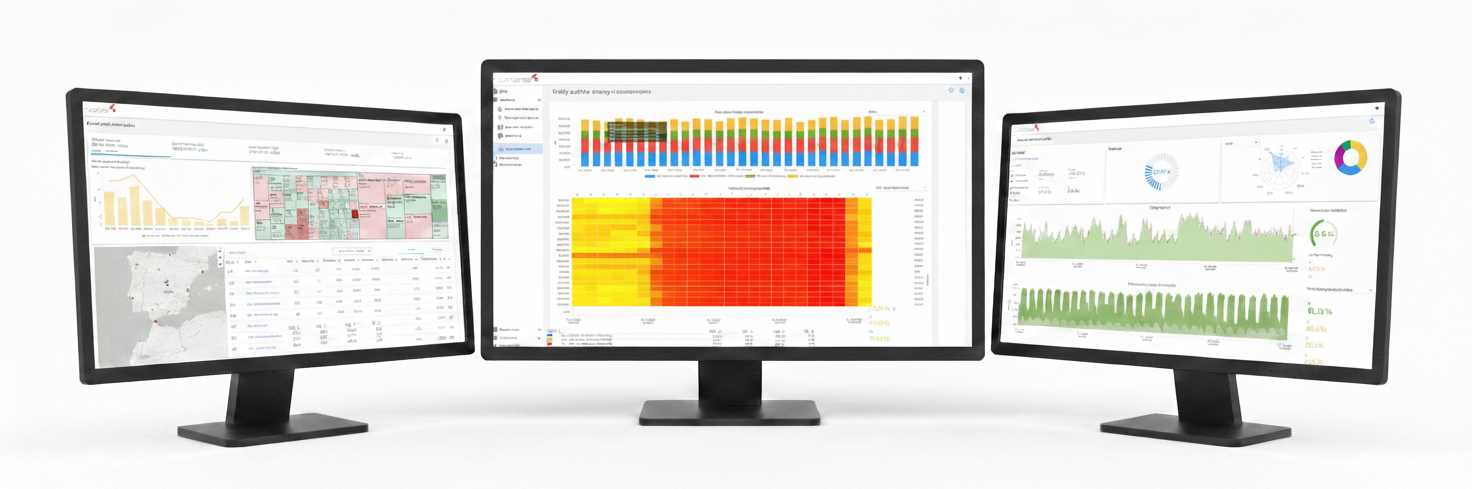
A unified platform for advanced energy intelligence
Measure
Analyze
Secure
Optimize
Integrate
Report
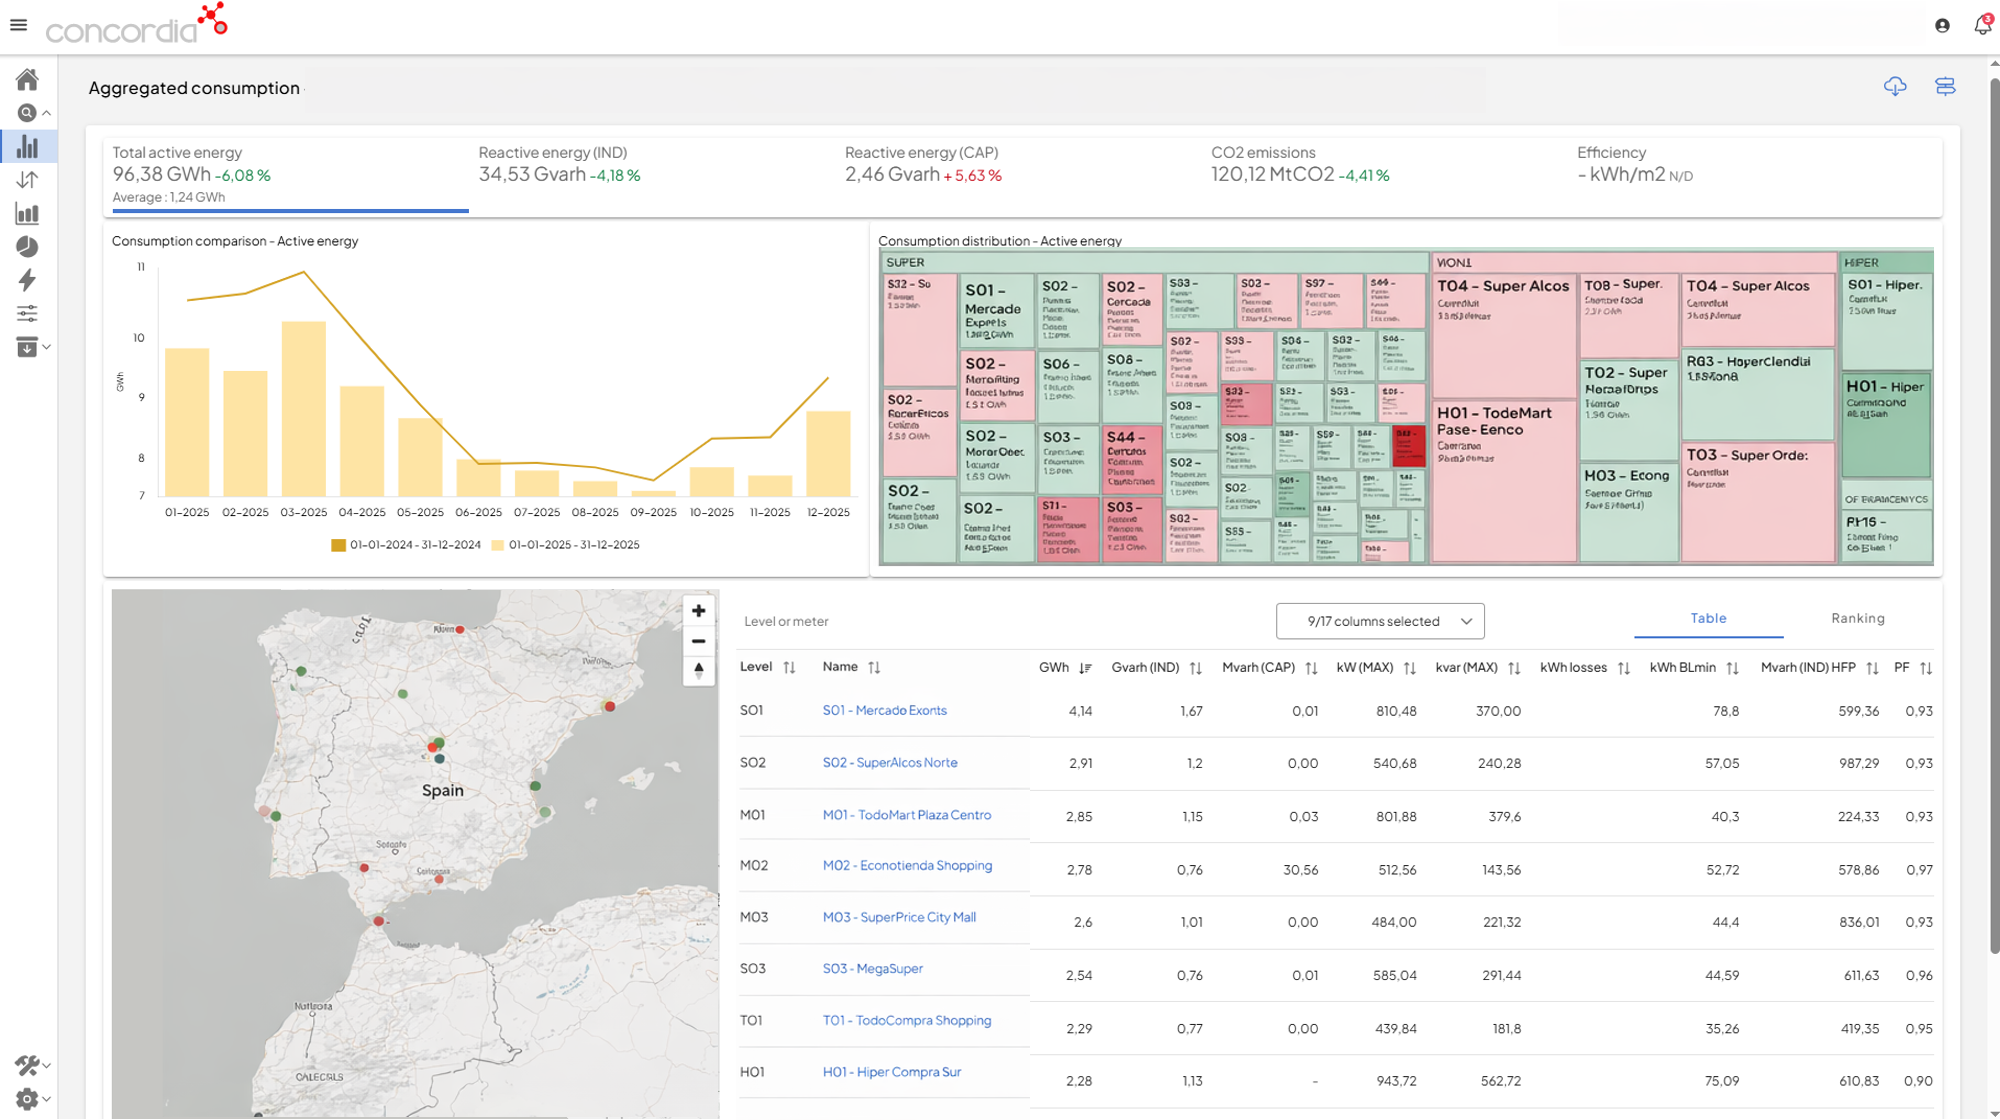
Automatic aggregation from meter-level data to corporate energy views
Concordia Energy enables unified multi-site energy analysis by automatically aggregating consumption data from individual meters into structured corporate views. Using dynamic hierarchies, energy performance is consolidated across sites, plants, and regions while preserving full traceability to the original measurement points.
This allows energy managers to compare locations, identify high-impact sites, monitor overall performance, and understand how each asset contributes to total energy consumption. Combined KPIs, rankings, temporal trends, and geolocated views provide a clear and consistent picture of energy usage across the entire organization.
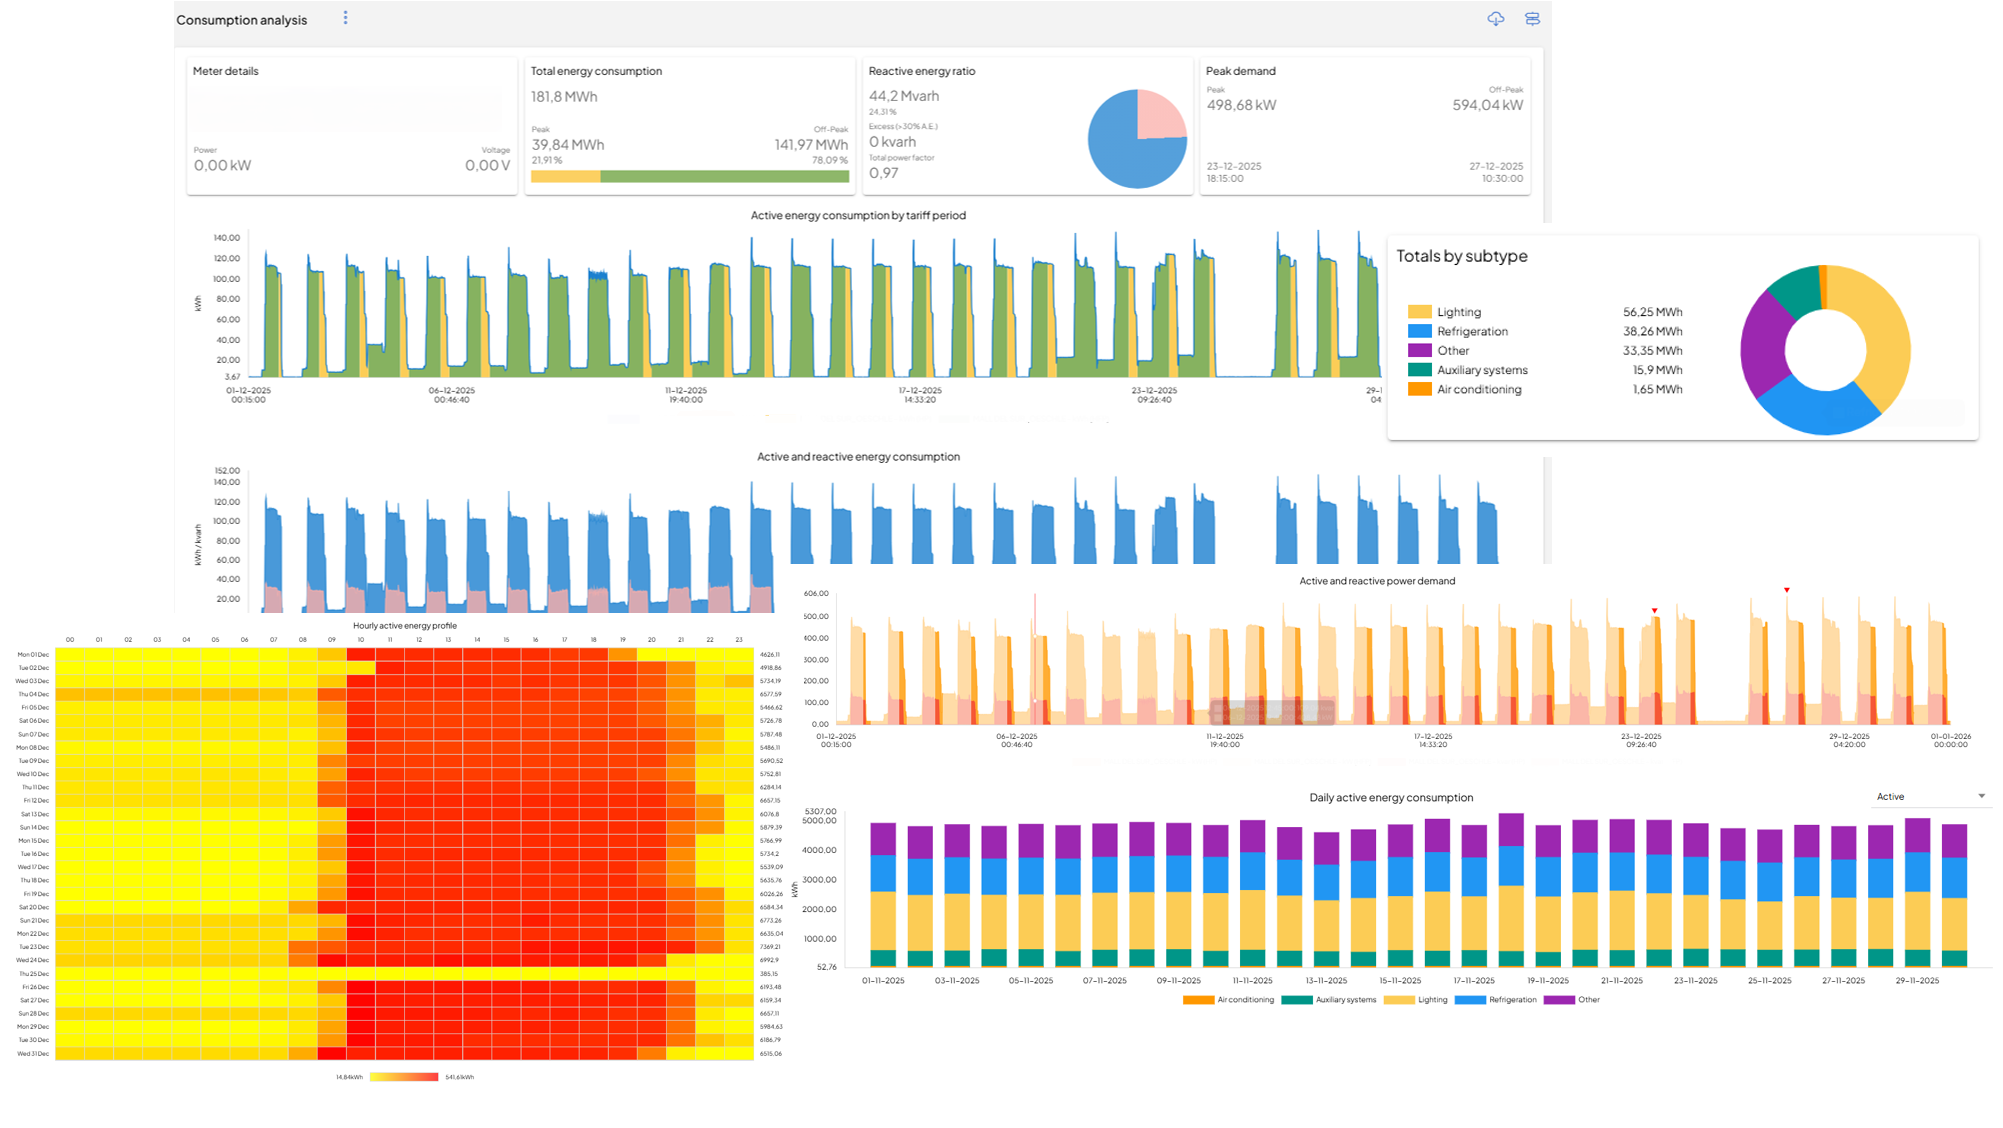
Deep visibility into energy consumption down to load level
Concordia Energy provides a comprehensive view of energy consumption at both meter and load level, combining key indicators, time-series analysis, and advanced visualizations within a single dashboard. In addition to total consumption, peak and off-peak usage, reactive energy ratios, power factor, and maximum demand, the platform enables detailed submetering analysis by energy subtype.
Consumption can be broken down by load categories such as lighting, refrigeration, air conditioning, auxiliary systems, or residual loads, revealing how energy is distributed across end uses. Detailed charts expose consumption patterns over time, correlate active and reactive behavior, and highlight daily trends and hourly profiles through intuitive heatmaps. This level of granularity allows energy managers to pinpoint inefficiencies, validate operational strategies, and prioritize optimization actions based on the actual sources of energy consumption.
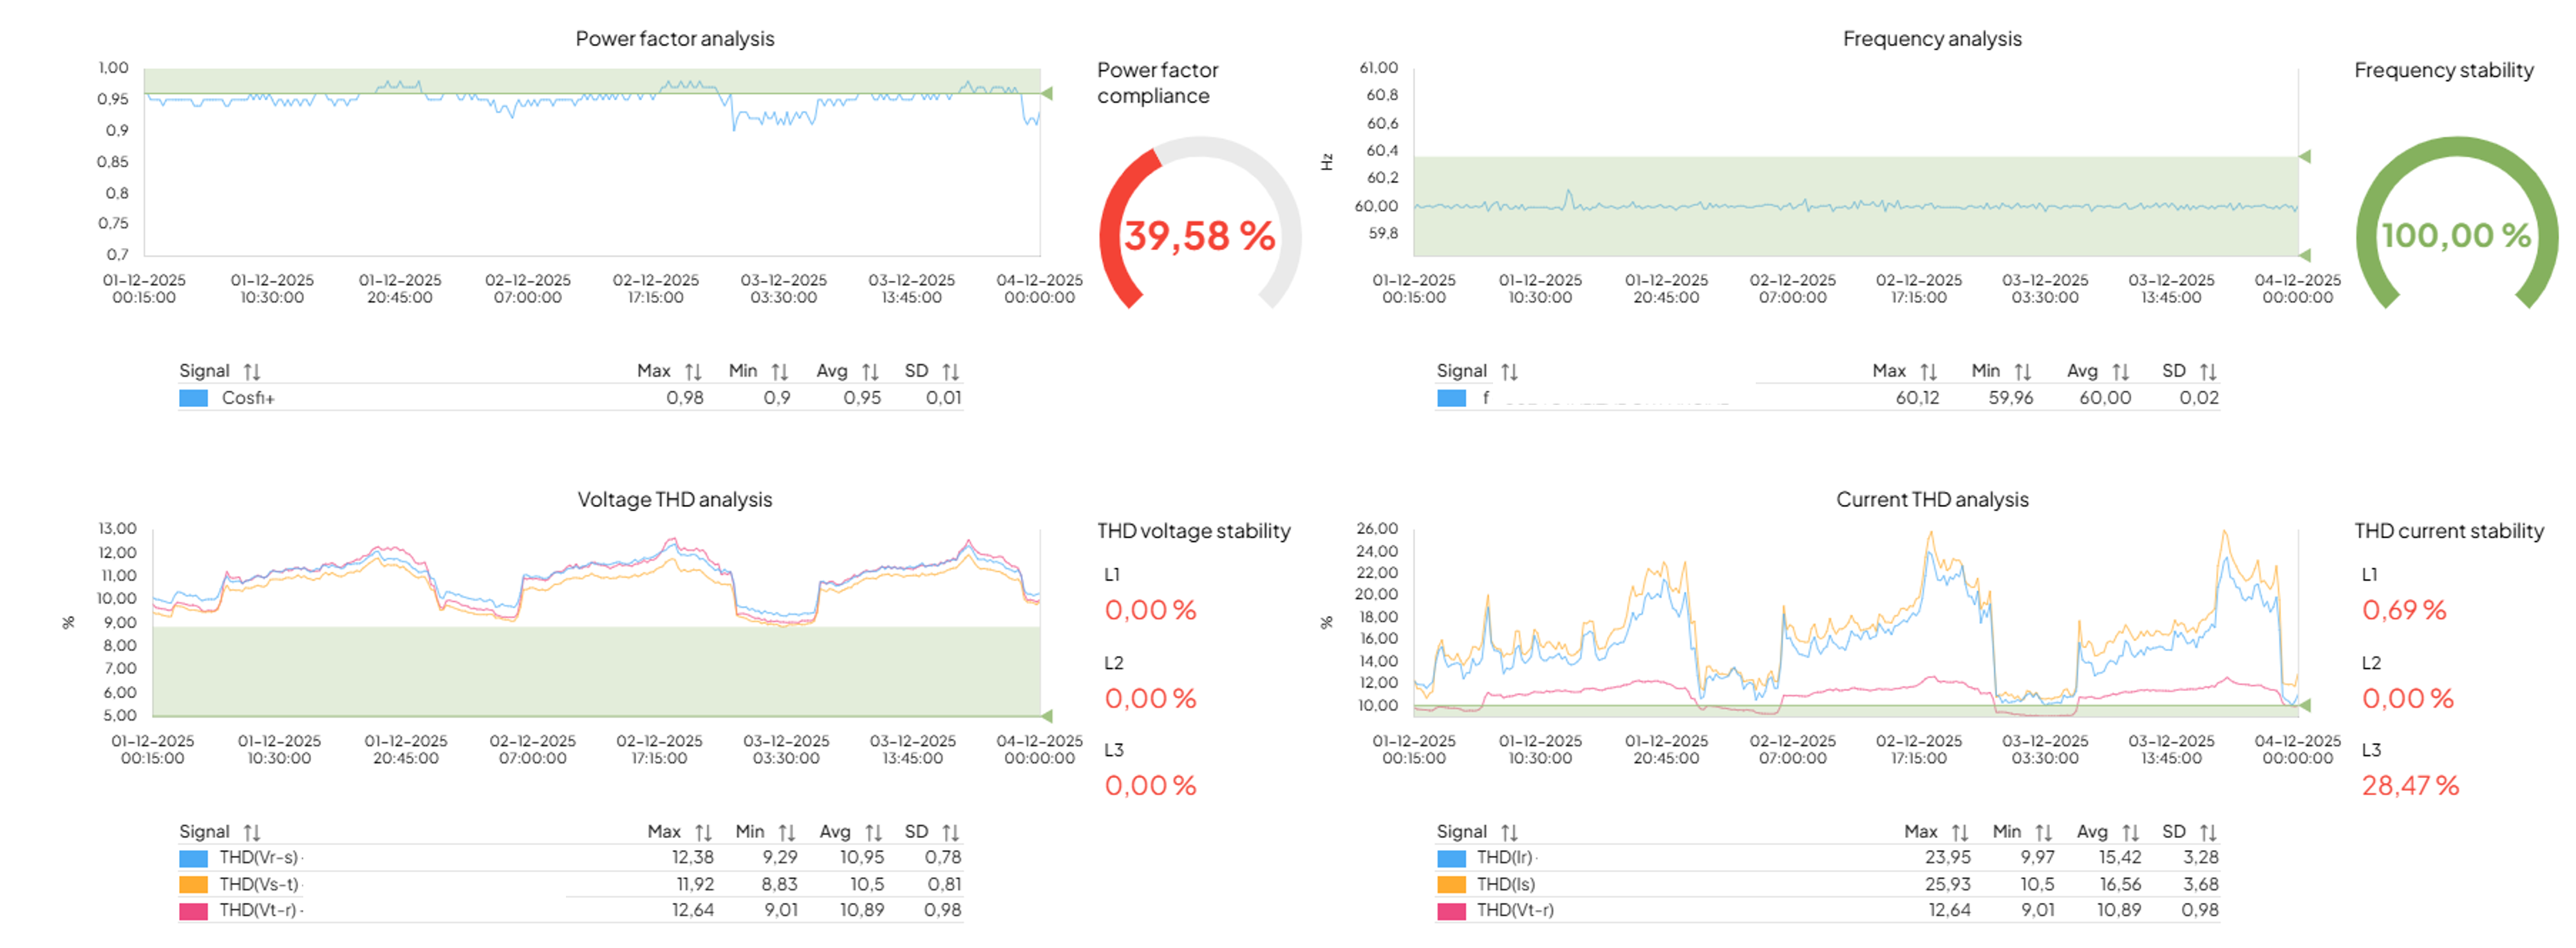
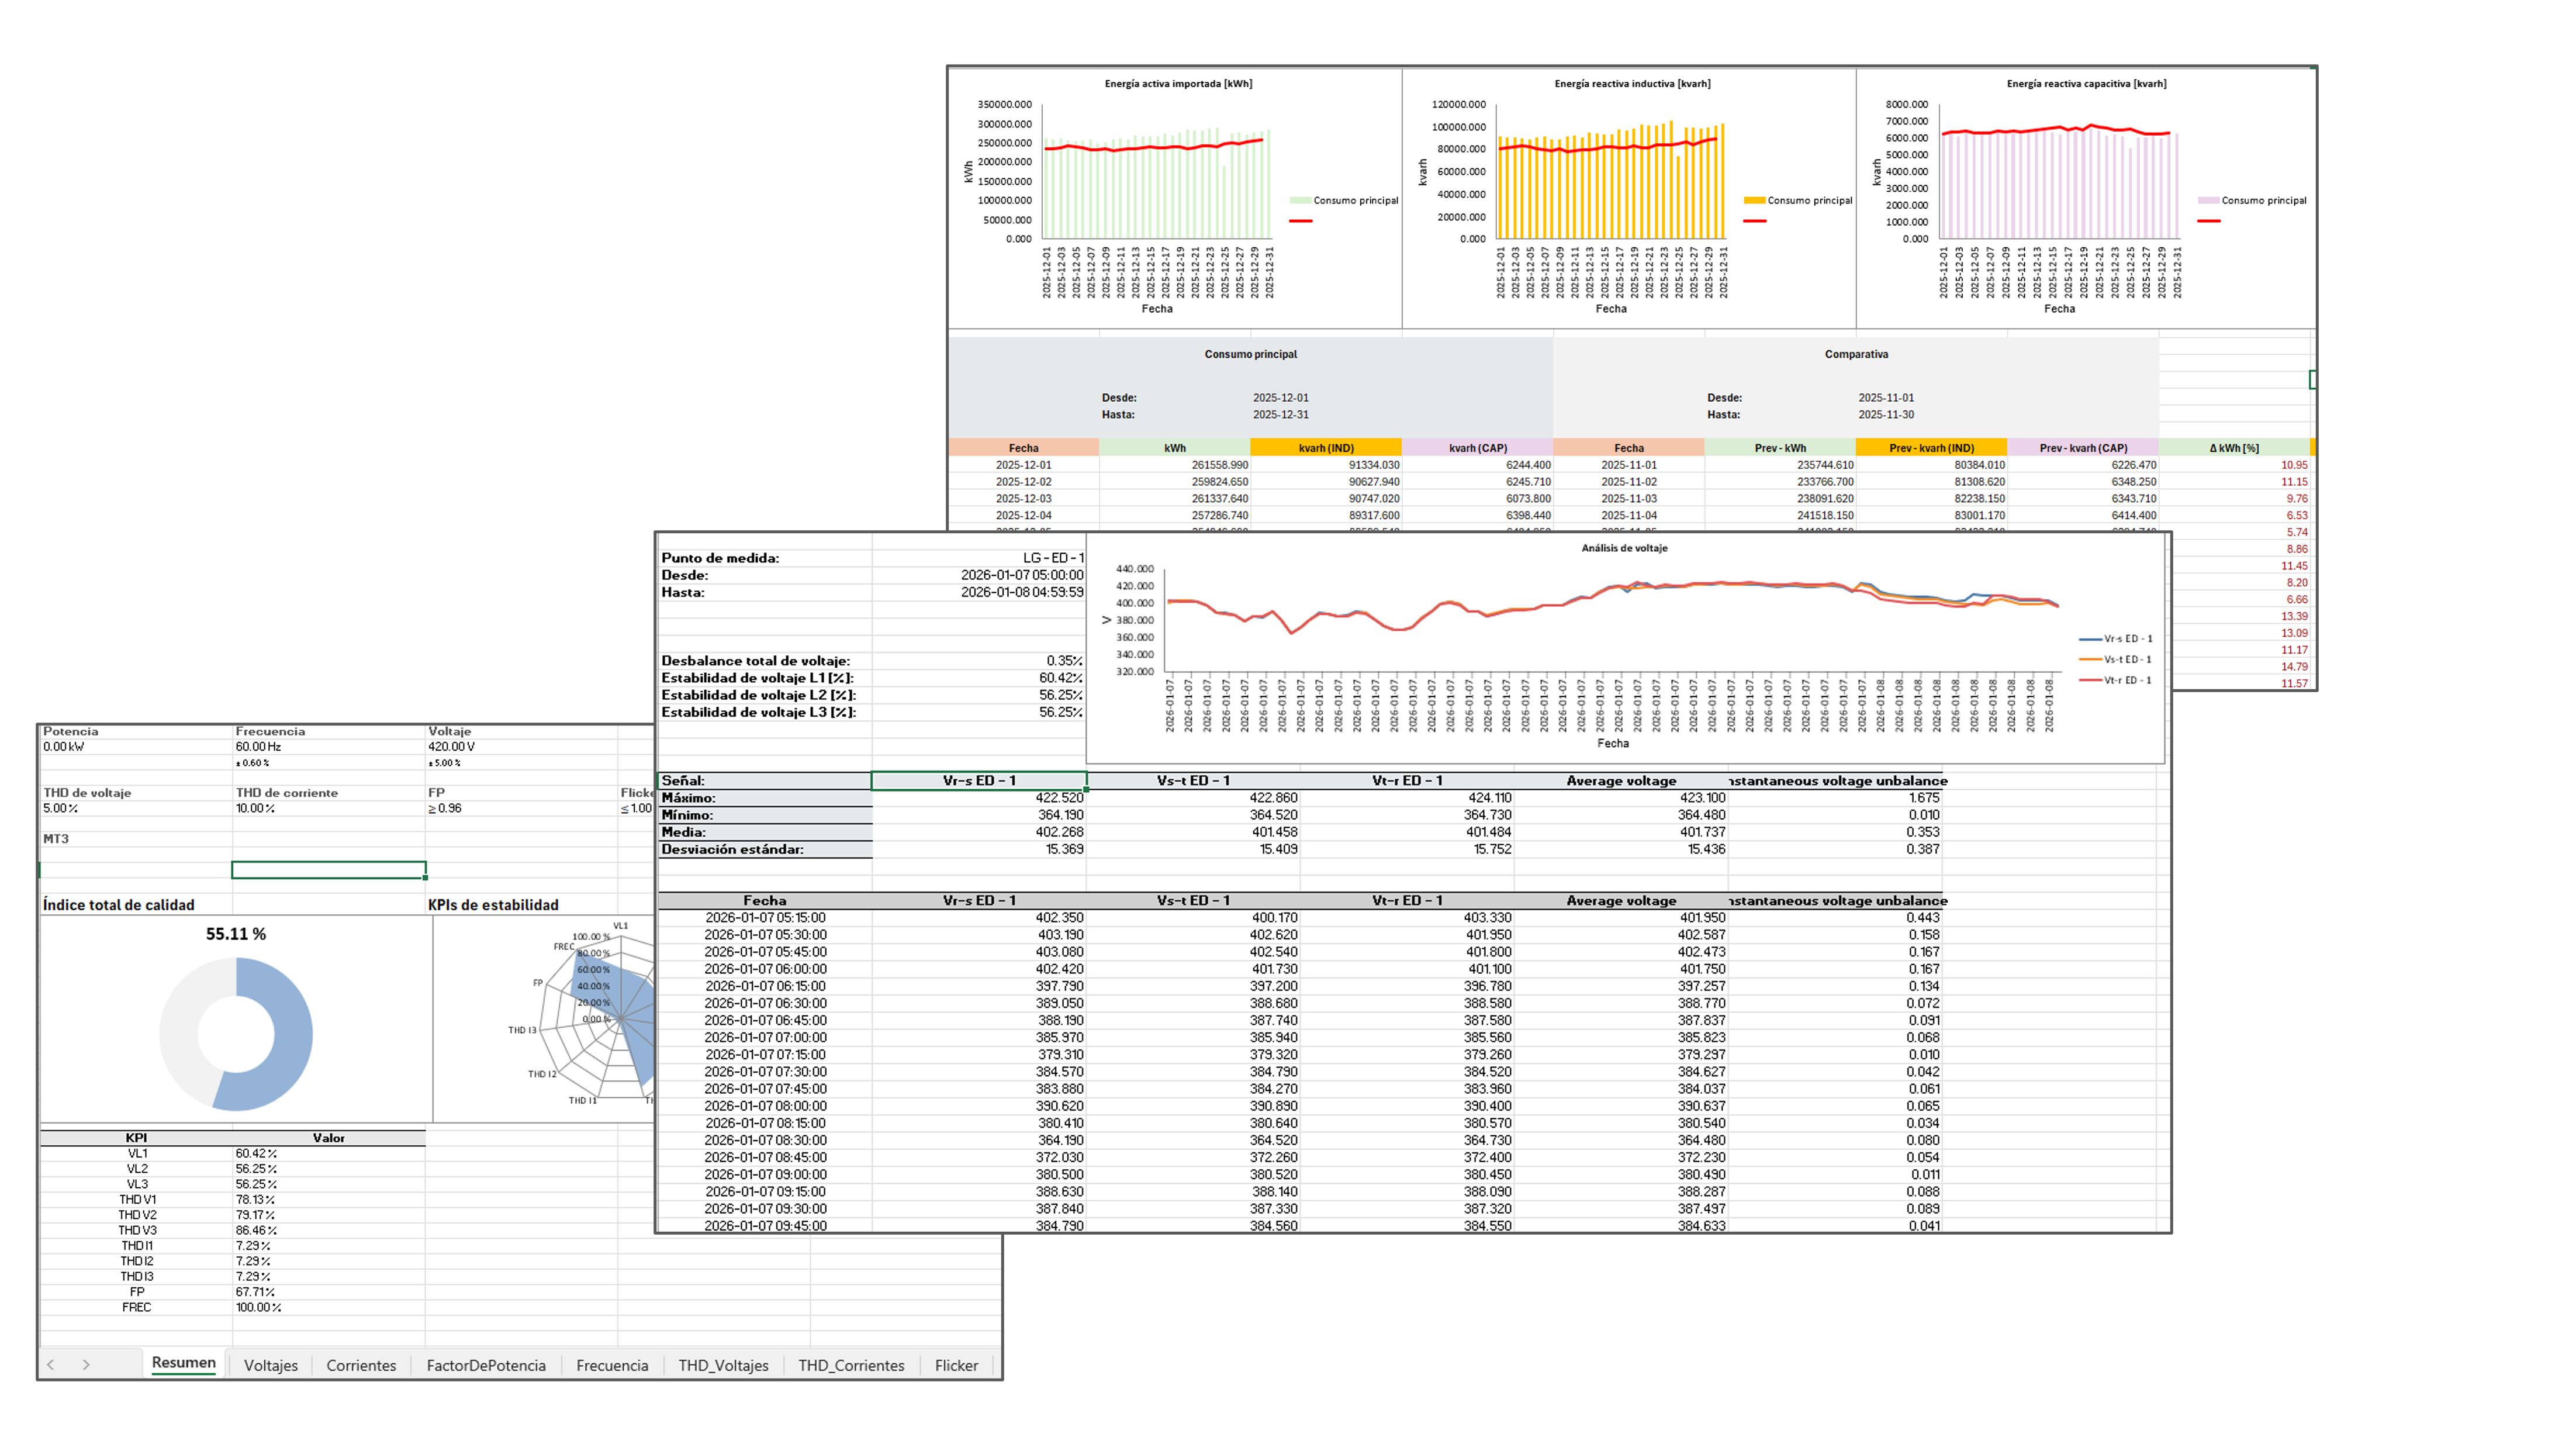
Continuous monitoring of power quality and electrical stability
Concordia Energy provides comprehensive power quality monitoring by continuously analyzing electrical parameters such as voltage, frequency, power factor, and harmonic distortion. Key quality indicators are evaluated in real time and over historical periods, offering a complete view of network stability and electrical performance.
Dedicated visualizations enable detailed assessment of power factor compliance, frequency stability, voltage unbalance, and total harmonic distortion (THD) for both voltage and current across all phases. Aggregated quality scores, trend analysis, and threshold-based indicators allow energy managers to quickly identify deviations, assess compliance with standards, and detect potential risks to equipment, processes, and energy efficiency.
Comprehensive energy reporting across consumption, quality, and billing
Concordia Energy provides automated and on-demand reporting that consolidates energy consumption, submetering, power quality, and billing data into structured and professional reports. All reports combine detailed tables and graphical analysis, ensuring full transparency and traceability across all monitored assets.
Reports are generated and managed centrally in the cloud, allowing users to access historical and current information at any time. In addition to interactive access through the platform, reports can be automatically distributed by email to predefined recipients, supporting operational follow-up, billing validation, audits, and management reporting without manual intervention.
Who Concordia Energy is for

Offices & commercial buildings
Corporate offices, business parks, hotels, and mixed-use buildings.

Retail
Multi-site retail environments requiring centralized energy visibility and benchmarking.

Industrial facilities
Manufacturing plants and industrial sites with advanced submetering, load analysis, and power quality requirements.

Utilities & substations
Energy operators and grid infrastructure requiring reliable monitoring of consumption, flows, and power quality

Data centers
Mission-critical facilities requiring continuous energy and power quality monitoring to ensure reliability and efficiency